3 interesting Statistic Distribution
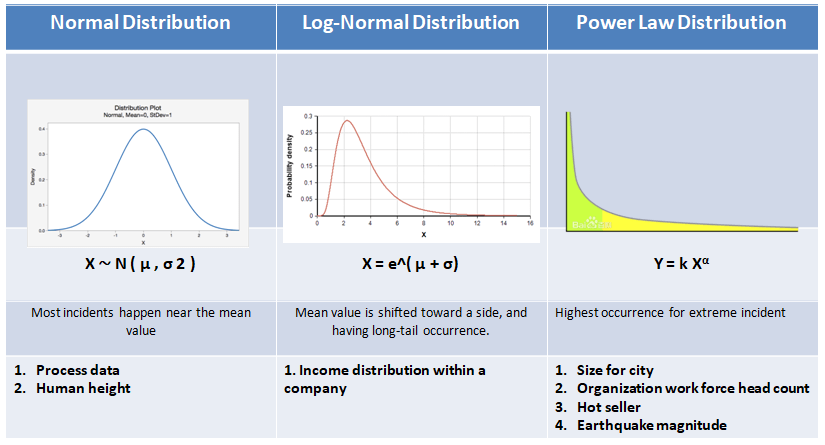
Statistic modeling is always an interesting topic which describes many phenomenons. For instance, the Normal Distribution is a well-known distribution to many of us. Besides, the normal distribution, I would like to introduce another 2 important statistic distribution in this article.
Many phenomena are well descript in Normal Distribution. But Log-Normal Distribution and Power Law Distribution are more appropriate to demonstrate the low occurrence incidents.

Quality and Statistic Tools
6-sigma methodology is a quality management tool that is very popular in the manufacturing environment, meanwhile, the methodology is developed base on Normal Distribution Modeling.
Efforts and preventing actions have been vigorously implemented in order to reduce the discrepancy occurrence. But in reality, could we eliminate the low occurrence rate discrepancy by implementing those actions? We will talk about this after we go through the 3 statistical distributions.
Normal Distribution – The Most Well Know Distribution

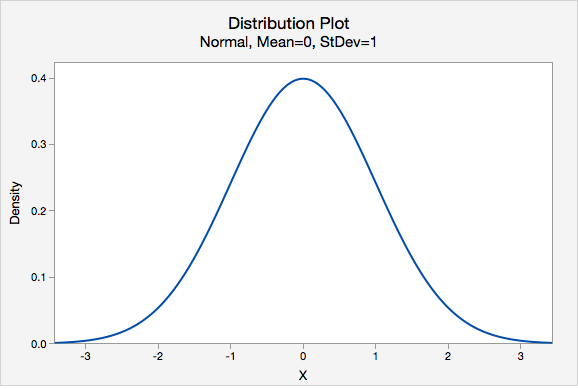
People always talk about normal distribution and having the perception that normal distribution is modelling the actual situation. Indeed in manufacturing environmental, data is plotted & calculated with a normal distribution. SPC activities are derived from the characteristic of normal distribution. Perhaps, SPC is an effective tool to apply in our production for process control.
Understand some background criteria, so that you could avoid them before we apply the normal distribution, they are:
- Central limit theorem
- All occurrence is independent
- Finite value for standard variation
- “Average” calculated from the occurrence data
Log-Normal Distribution – Inherent in our Life

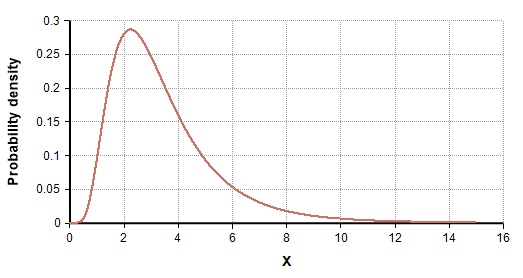
The log-normal distribution looks similar to the normal distribution at the first glance. However, there are 2 major characters in log-normal distribution:
- Skew to one side
- More long tail effect
Long-tail effect or higher extreme occurrence rate in log-normal distribution as compared to normal distribution. I have come across several incidents that the modeling that shifted from normal distribution to log-normal distribution after some time of implementation. This is because the data is calculated with the “multiply” effect. For instant incentive is given a base on the percentage for a sales value. This “multiply” effect will eventually lead the hot seller is having higher pay in the organization.
Power Law Distribution – Exceptional but this is Reality

Power law distribution has been neglected on many occasions, but it is always there. For instance, the Pareto rule or 80/20 rule is the best scenario to describe Power Law distribution.
In the Power Law distribution or modelling, we are seeing more long-tail occurrence, even larger extreme occurrence rate than the log-normal distribution. One of the famous books, Long Tail Effect, actually describes the effect of Power Law distribution.
Let say modelling behave as Power Law distribution, please be prepared for the occurrence of the extreme incident. While I am saying “prepared”, it means we should “emotionally ready” to face a challenge, because extreme incident may happen.
The Power Law distribution appears because the organization is getting bigger and complex. Many of the variables in the organization is interacting with each other and causing severe “multiply” effect. Even small snow may eventually lead to avalanche but the feather-light snow should not be the finger-pointing cause for the disaster.
The world is always challenging and full with hypothesis. With these 3 modelling in mind, you will be equipped with a better knowledge to examine the scenario and identify the root cause. The modelling is always there and now is your turn to decide which modelling you are going to select in the actual scenario.


Do u think BSI(Body Shape Index) fulfil Normal Distribution?
BSI(Body Shape Index) is a popular index to examine individual health situation after considering the mass (weight), height and waist circumference. Through the study, the BSI index = Weight/Height^2.
In an ordinary situation, I would presume that the “Weight” and “Height” within a population fulfil Normal Distribution. However, in BSI index, it is derived from a formulation with “/(divide)” and “square” operation, from mathematic judgement, we could conclude that BSI index DOES NOT fulfil Normal Distribution.
[…] on the SIR model, the infection count shall grow in an exponential […]